Wednesday, December 29, 2010

FBMKLCI Futures - Daily Messaga 30 Dec 2010


FKLI bias remains up and a close above 1530 support should keep bias intact.
Resistance may come at 2008 high of 1536 and thereafter intraday all time high of 1546.
Wednesday afternoon's low of 1525 could be a minor support. Further support is expected at 1523, 1513 and important one at recent low of 1485.
Sentiment stayed positive as futures is at premium to cash, while Jan contract too is trading above its roll fair value.
21 day moving average is now at 1508.

Tuesday, December 28, 2010

FBMKLCI Futures - Daily Message 29 Dec 2010


FKLI bias is still up and a close above 1523 support should keep bias intact.
Resistance is still Nov high of 1530 and then all time high of 1546.
Support may come at 1518 and then 1513. Further below 1502, 1489 and important support still at 1485.
Sentiment stayed boyant as futures is priced rich to cash.
21 day moving average is at 1506.

FBMKLCI Futures - Daily Message 28 Dec 2010


FKLI bias is still up despite the 3-day consolidation and it has to close above 1518 soon to keep bias intact.
Resistance is still Dec high of 1523 and the Nov high of 1530.
A close below 1513 likely turn bias down. Further support at 1502, 1489 and important one at 1485.
Sentiment was still positive as futures was priced at slight premium to cash.
21 day moving average is at 1504.

Monday, December 27, 2010

CPO Futures - Uptrend Still Good


We believe bias is still up on the short term basis while, uptrend on the longer term is still intact. There is yet any clear sign of changing trend in longer term basis despite the bearish engulfing pattern on weekly chart two weeks back (chart 3). The strong move last week have somewhat eased the bearishness though a close above 3750 is required to completely erase any possible weakness.
The shorter term trend is also looking up. We believe price has recently made bottom at around 3450 as:
1) 30 min RSI was oversold, lowest since 3100 bottom;
2) Daily stochastic may have turned back into buying mode;
3) Nov high of 3450 turning support;
4) Last week upmove retraced more than 61.8% of 3750 – 3470 downmove;
5) The grain complex are moving higher again, new high in corn, soybean and beanoil and
6) 3470 bottom is 17 days after 3100 bottom, possible midway of 35 day cycle.
However, price has to close above the 2 day high of 3675 to confirm the bullish bias. Price may turn weak on close below 3640 and expect selling pressure to increase on close below 3500 and definitely 3470.
View the full report here http://www.osk188.com/Dindex.jsp 

FBMKLCI Futures - Daily Message 27 Dec 2010


FKLI bias is still up despite the sideway move on Friday. A close above 1517 should keep bias intact.
Resistance is 1518, which stopped price for the past 3 days and thereafter 1523.
Support is still around 1513 and 1510, though a close below 1513 may turn bias down, for at least tomorrow.
Further support is at 1502, 1489 and strong one at 1485.
Sentiment was positive as futures was at premium to cash. Rightly, positive sentiment should see higher price.
21 day moving average is now at 1503.

Friday, December 24, 2010

FBMKLCI Futures - Daily Message 24 Dec 2010


FKLI bias is still up and close above 1517 should keep bias intact.
Resistance is still 1523, not too far from yesterday's high. Next resistance is November high of 1530.
Support should come at yesterday's low of 1513. A close below it and especially 1510 could see a weaker Monday.
Further support possibly at 1502, then 1489 and stronger one at 1485.
Sentiment was positive yesterday as future was at premium to cash.
21 day moving average is now at 1502.

Thursday, December 23, 2010

FBMKLCI Futures - Daily Message


Bias is still up and close above 1516 should keep direction intact.
Resistance is yesterday's high of 1517.5 and then 1523 and Nov high of 1530.
Still believe support is far below, possibly at 1510 and 1502.
Strong support should be at Friday's low of 1485.
Sentiment is neutral as futures was priced about fair.
21 day moving average is now at 1501.
A close above 1516 should see the break of trendline connecting recent 2 highs (Nov and Dec)

.


Wednesday, December 22, 2010

FBMKLCI Futures - Daily Message


Bias has turned up and close above 1514 should keep bias intact.
Further resistances at 1517, 1523 and 1530.
Given strong move yesterday, supports are far below. Possibly at 1510, 1502, then 1489. 1485 should be an important support.
Again, price should go higher given the daily long white candle.
21 day moving average is at 1501.

Tuesday, December 21, 2010

Dow e Mini Futures - Monday Weakness


Price is showing a short term weakness on a back of positive long term picture. The question is, was Monday's price action a blip and making a base for next upleg or the beginning of correction of at least December rally.
The longer term picture looks up especially after trading above 11200 for 3 weeks now (chart 2 & 3). Therefore, the weakness on Monday can be interpreted 2 ways. It could be a start of correction as:
1) Price broke below Friday’s low and failed to trade above it (red line in chart 1);
2) Weakening momentum with lower high of RSI in both 30 mins and daily chart.
If that is so, price should close below Monday’s low, preferably below 11400 support. Retracement levels are 11300 (38.2%),  11220 (50%) and 11150 (61.8%).
It could also be a base building as:
1) Long term trend is up;
2) RSI is most oversold since start of Dec rally (chart 1);
 3) S&P 500 continue to print higher close; and
4) It has only been 15 days since Nov low, upcycle can accommodate further upward movement.
If so price should trade back above Friday’s low and eventually break 11520 high.
View the full report here http://www.osk188.com/Dindex.jsp 


FBMKLCI Futures


Bias is still down but may turn up if trades and closes above 1498.
Resistances at 1502, 1510.
Supports at yesterday's low 1489 and Friday's low 1485. Downward pressure likely increase on close below 1480.

Monday, December 20, 2010

FBMKLCI Futures - Consolidation


Price is still consolidating within a longer term uptrend. We believe long term trend have yet to turn down as:
1) FKLI yet to chart lower low since May, it is not even below Oct low of 1470
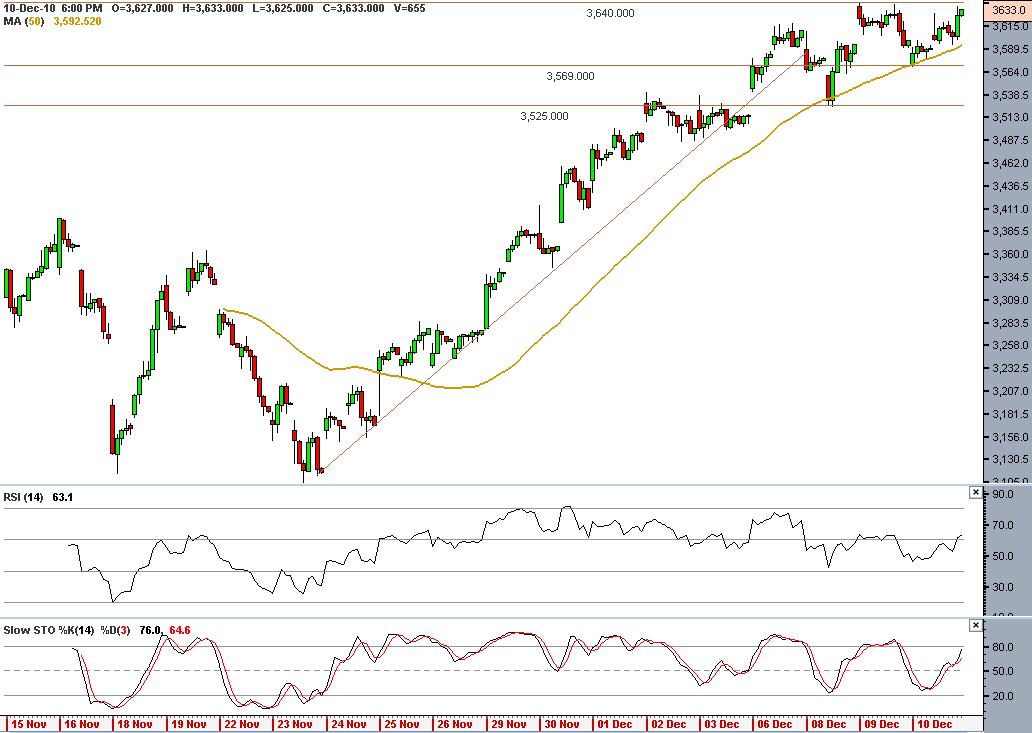
2) Still above its 20 week moving average (chart 3) and just above medium term trendline (chart 2)
3) Yet to make significant bottom since May
But price is still consolidating as:
1) Yet to trade above Nov and all time high of 1530 and 1536;
2) Yet to trade below 1470, the low of Oct and Nov; and
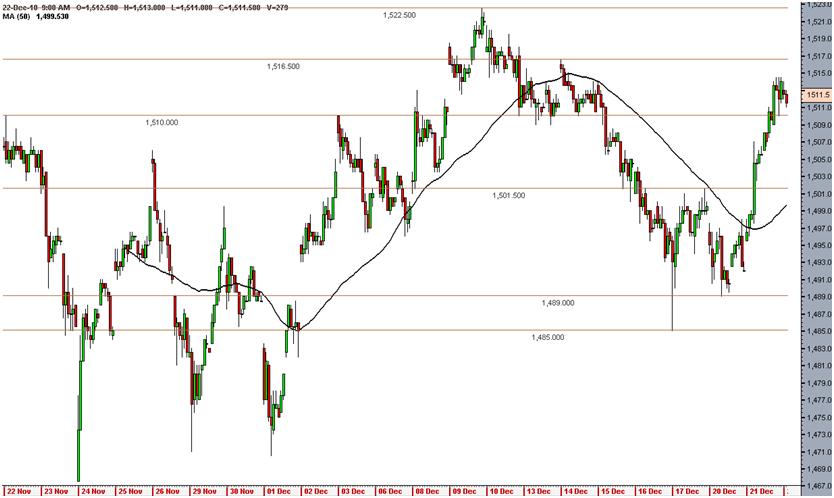
3) 21 day moving average still flat (chart 2).
Trend is still uncertain until either level is broken convincingly. Nonetheless, on a short term basis price is still trending lower since 9 Dec, as price is below both trendline and moving avg (chart 1). But last Friday action could provide signal for immediate direction. We had a first positive close in 6 days right after high volume trade at 1485 low. The close was also above the medium term trendline. That day was also 60 days since Sep low, which is about 2x the prior cycle of 28 days.
Therefore, if price is to turn up and 1485 is the latest bottom, price should close above Friday’s low but if short term downtrend to continue, price will trade below 1485. Expect downward pressure to increase on close below 1480.
Do note that global equities are giving mix picture at the moment with the US continue to print higher close while weaknesses are seen in some emerging markets. Mean-while, Asean currencies are also showing weakness and in the past few year, Asean equities rose on stronger currencies. We believe that whatever the next trend turns out to be, developed markets equities and currencies should confirm the move too.
View the full report here http://www.osk188.com/Dindex.jsp.

Monday, December 13, 2010

COMEX WTI Crude - Consolidation On-Going


We believe that price is currently correction a longer period uptrend. The uptrend is based on:
1) Upward trendline and price above moving average (Chart 3),
 2) Break above early year high of 87, and staying above it more than a week.
However, on a very short term basis, price is on a correction as:
1) Upward trendline from 23 Nov is broken, and
2) price is making lower high, red lines on Chart 1.
Given the longer term upward bias, buying is expected to resume. But buyers will only get an upper hand if price can trade above the red lines, the lowest at 89 and has to trade above 91 to confirm the strength. Otherwise expect selling pressure to continue, especially on close below 87.  The fibonacci retracement levels are 86.7 (38.2%), 85.4 (50%) and 84.2 (61.8%)
Note that the break of green triangle was not followed by selloff which is positive for buyers.  At the same time, energy related stocks at NYSE had a good close last Friday despite the 3 day commodity correction. So there are few things going for buyers, but again strength has to be confirmed by break above the red lines.
Similarly, WTI crude has to trade above MYR 280 to confirm the bullish bias.
View the full report here http://www.osk188.com/Dindex.jsp 

FCPO - A Thrid of Cycle Through


Price is still on uptrend on both short and longer term basis. On short term basis price is above moving average (50-period) and charting higher lows (Chart 1). No sign of changing trend too in the longer term as all techinical signal is still positive (Chart 2 and 3).
But we do note that momentum has weakened based on:
1) Divergence in the daily RSI, and
2) Break of sharp uptrendline on 30 mins chart.
Therefore, the question is how much higher will this new upcycle go? Late november low of 3100 should be lastest bottom based on:
1) Recent daily RSI and stochastic bottom,
2) Oversold RSI on 30 mins, and
3) Cycle sequence of 35-25-34.
We are entering day 13 of new cycle and if upcycle continues, we should have at least another 5 day of higher prices and first signal should be a close above 3640, tested 3 times in the past 2 days. If we are already at mid-cycle, two signs to look for are the failure to close above 3640, break below MA and finally then a close below 3525 (RSI low in Chart 1) in coming few days.
Notice too than beanoil is testing its Nov high, and reaction to the test may also provide lead. Then expect both CPO and beanoil to move together. Looking at equities, currently there is a divergence where come stocks are making all time high while IOI and Sime is similar to CPO, yet to make new high. If the new highers are leading this rally, then expect further upside.
View the full report here http://www.osk188.com/Dindex.jsp

Wednesday, December 8, 2010

FBMKLI Futures: Correction - How far will it go?


Price is currently on a correction within a longer term uptrend. We believe long term trend is still up as:

1) FKLI yet to chart lower low since May, it is not even below Oct low of 1470
2) Still above its 20 week moving average (chart 3)
3) Yet to make significant bottom since May

However, on the short term basis, price is trending lower. It is clear from chart 1 that price is making lower high of 1510, 1506 and 1500 (also near 21 day moving average). Nontheless, supports isn't too far at 1480 and 1470. Price is unable to trade below 1480 for a significant amount of time and at both times rebounded off October low of 1470.

Therefore, we believe that clear buying power will not be evident until price trades above short term resistance level, and especially with a close above 1510, despite the holding of support levels.  Alternatively, one can also monitor the rectangle 1500 - 1480 level which forms the weird shoulders, and trade support and resistance. As such, expect downward pressure to continue on close below 1480.

Note too taht the sideway move of RSI and stochastic too suggest that a complex consolidation, not signaling an end of down movement yet, contrast to the V shape bottom of Aug, Sep and Oct.

On cycle basis, price seem to move away from prior 28 day cycle but the 32 day upmove from Sep was probably long enough to suggest that we are still in up cycle configuration.

Fibonacci retracement of level of May - Nov move is 1350 (61.8%) and 1420 (38.2%).

View the full report here http://www.osk188.com/Dindex.jsp